4 simple steps to capture Google Analytics data in Jotform
Learn how to capture data from Google Analytics, such as Channel and Landing Pages, in Jotform so that you can see which marketing channels are generating leads & customers!

Google Analytics is a great tool for getting data on how visitors end up at your website. And if you set up Goals properly, you can also get information on which channels have converted to leads.
But imagine if you could see which marketing channels and campaigns are bringing in leads that convert into deals, customers & revenues.
By collecting Google Analytics data in Jotform and passing it through your CRM, you can run reports that show which channels and campaigns are actually generating you customers & revenue, and which one's are just generating visitors that don't convert.
With this information, you can make better decisions regarding your marketing efforts and grow faster.
4 steps for capturing Google Analytics data in Jotform
Using Attributer to capture Google Analytics data in Jotform is easy. Here's how to do it in 4 easy steps:
1. Add hidden fields to your forms
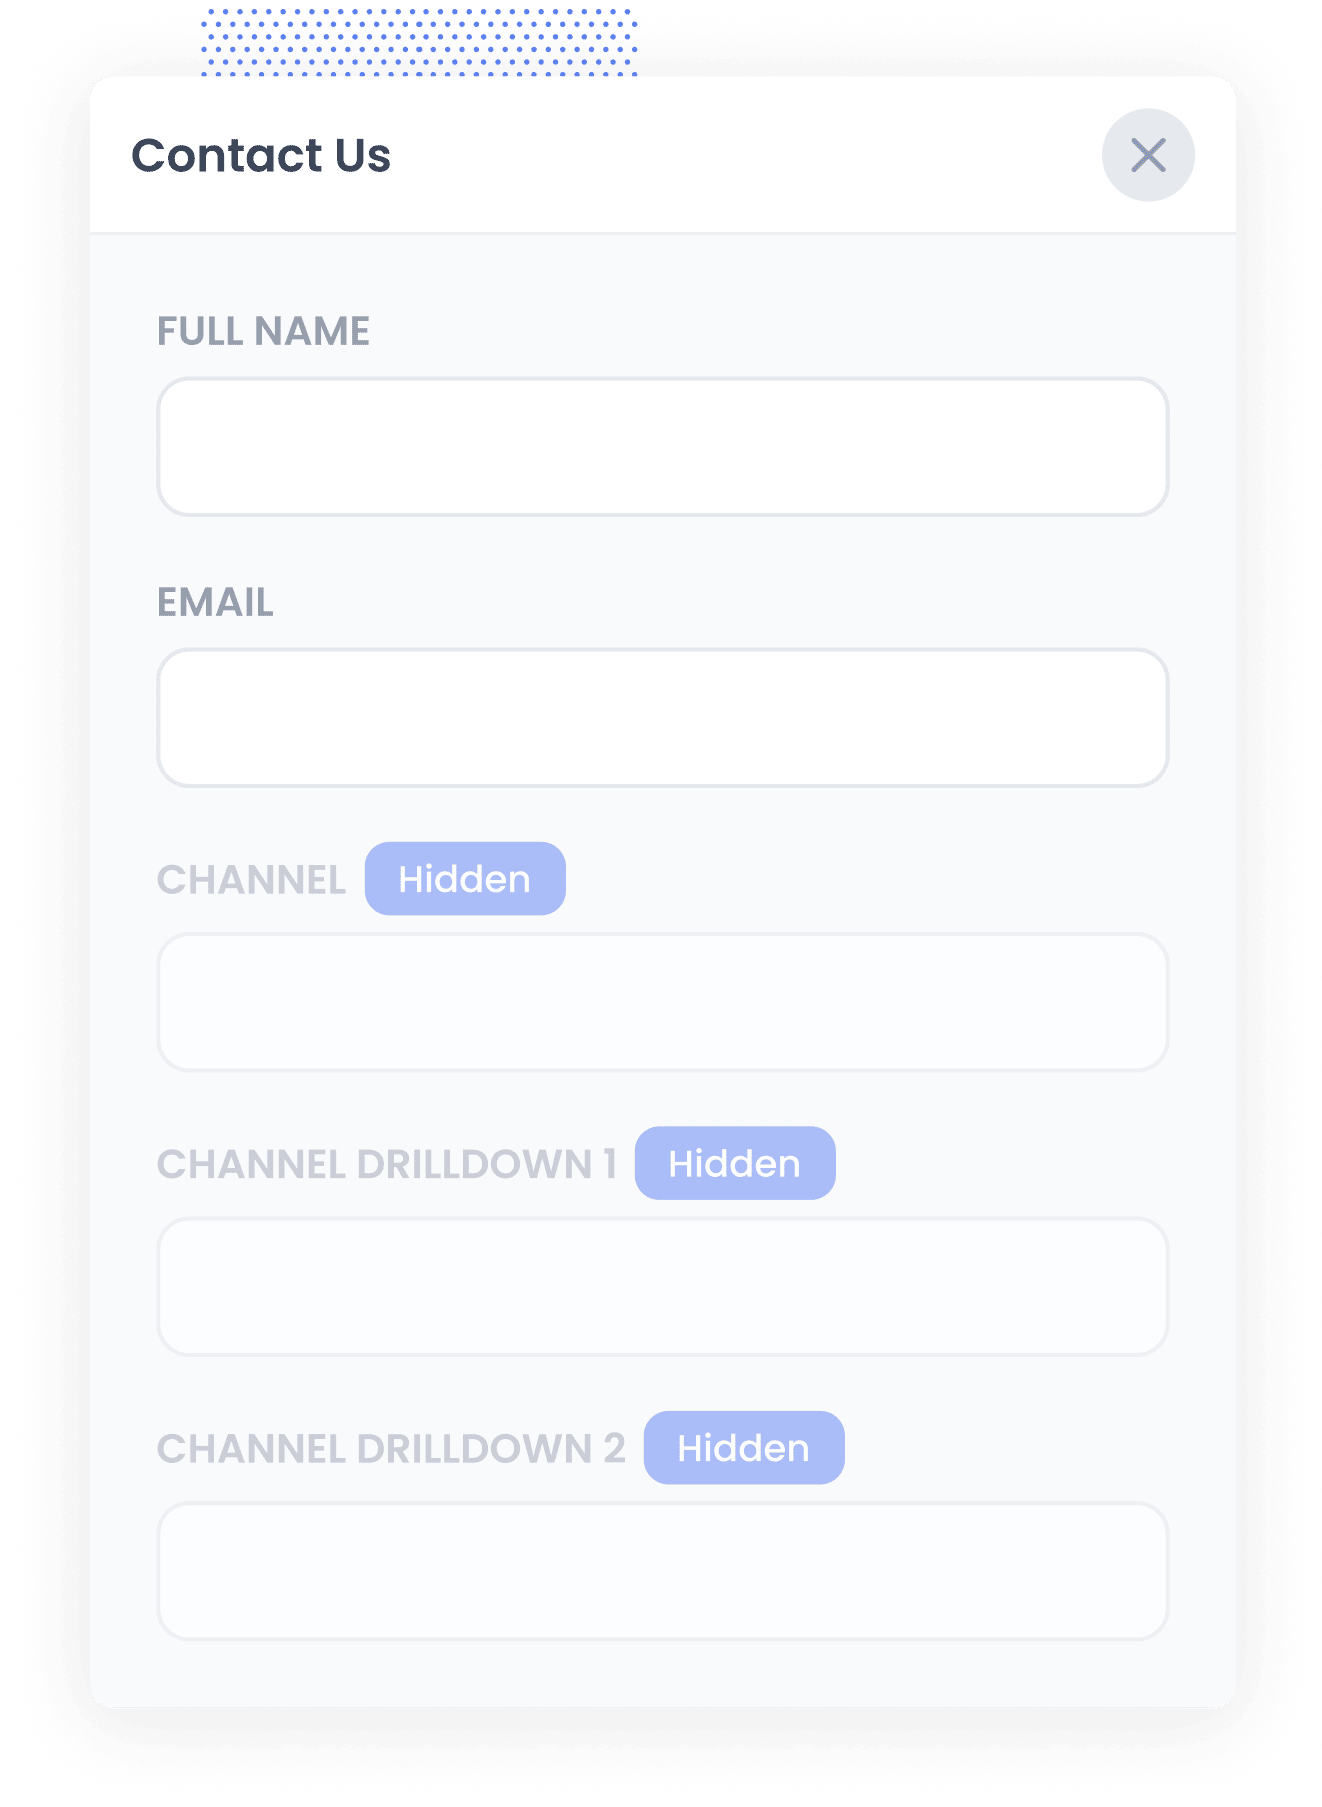
Start by adding the following hidden fields to your lead capture forms:
- Channel
- Channel Drilldown 1
- Channel Drildown 2
- Channel Drilldown 3
- Landing Page
- Landing Page Group
With Jotform, adding hidden fields is very easy. Simply drag a 'Short Text' field into your form and then open up the properties editor for that field. Once in the properties editor locate the option to 'Hide Field' and switch it on.
This will now mean that these fields are hidden from the end-user. Your website and forms will still look and function the same as before, except they'll now have a series of hidden fields that the Google Analytics data can be written into.
2. Attributer automatically completes the hidden fields with Google Analytics data
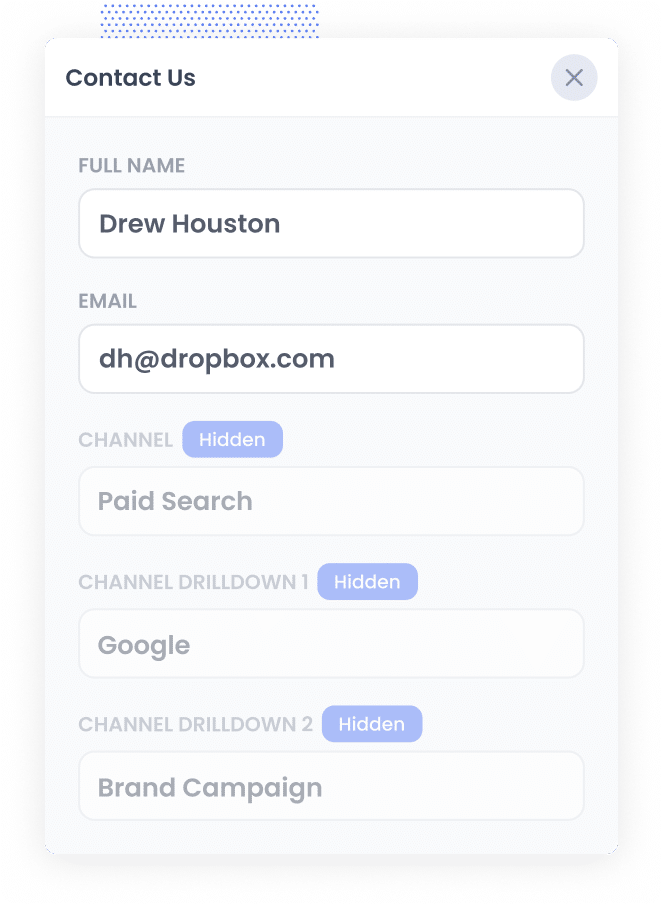
After adding hidden fields to your Jotform forms, Attributer will automatically populate the hidden fields with Google Analytics data associated with each user.
To illustrate, let's imagine you are a marketer for the popular cloud storage tool known as Dropbox.
A user searches ‘how can I share large files,’ and the search engine shows a Dropbox ad in the paid search results.
Once a user clicks on this and decides to fill out a form on the Dropbox site, Attributer auto-fills the hidden fields with Google Analytics data that may look like this (depending on what UTM parameters you use in the ad):
- Channel: Paid Search
- Channel Drilldown 1: Google
- Channel Drilldown 2: Brand Campaign
- Channel Drilldown 3: Dropbox
In addition to this information, Attributer will also collect the data about the landing page and category of that page, so you’ll know how exactly the user arrived at your website. Continuing our Dropbox example from above, this might look like this:
- Landing Page = www.dropbox.com/features/share
- Landing Page Group = Features
3. Google Analytics data is captured by Jotform
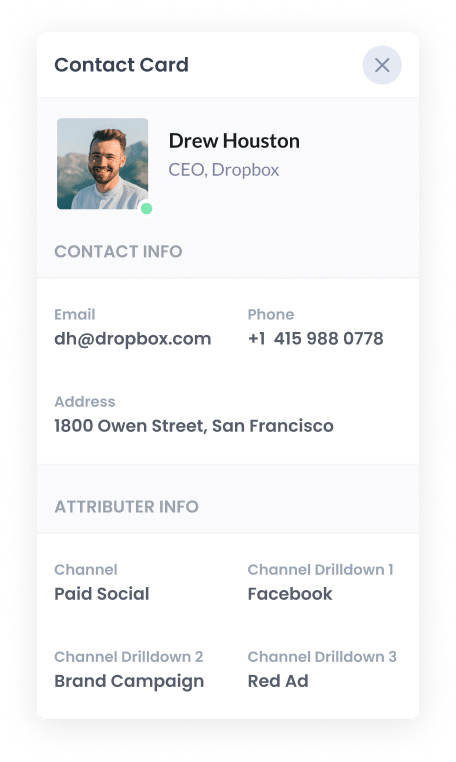
When the user finally submits the form, Jotform captures and stores all the information provided by the user (like their name, email, phone, etc) along with the Google Analytics data that was written into the hidden fields.
4. Run reports to see what's working
Lastly (and most importantly), you can then send the data through to your CRM (like Salesforce, Zoho, Pipedrive, etc) and any other 3rd party tools you have integrated with Jotform.
With the Google Analytics data alongside each lead in your CRM, you can easily do the following:
- Review which of your channels are driving the most leads
- Find out the conversion rate to Deal/Opportunity of each channel
- See the number of Closed Won deals coming from each channel
- Identify how much revenue you have generated from each channel or campaign
- Calculate the exact ROI of your various marketing initiatives
What is Attributer?
From the above steps, you've likely gotten a brief idea of what Attributer does, but let's elaborate.
Without getting too technical, Attributer is a bit of code you place on your website.
When a visitor arrives on your site, it looks at some technical information about how they got there to determine where the visitor came from (the same things Google Analytics look sat, such as the presence of UTM parameters, the HTTP referrer, etc).
Attributer will then put each user into a particular channel category (The same Channels you see in Google Analytics, like Paid Search, Organic Search, Paid Social, etc.), and save this information in the user’s browser.
Then when a user completes a lead form on your website (like your Contact Us or Request a Quote form), Attributer writes the Google Analytics data into the hidden fields you added to your forms and it is captured by Jotform alongside the information the lead entered into the form, like their name, email, phone number, etc.
What data gets captured in Jotform
Here at Attributer, we believe there are 2 essential factors to attribution:
- Channel - How did they arrive on your website? Usually one of Organic Search, Paid Search, Paid Social, Referral, etc.
- Landing Page - What content on your site appealed to them there? It could be your Features pages, blog, ebooks, etc.
To help you answer all these questions, we built Attributer to collect all the information you need to reach informed decisions.
1. Marketing Channel Data
Attributer will pass through marketing channel data on ALL of your leads (not just those from paid campaigns with UTM parameters).
This means you will be able to monitor which channels (Paid Search, Paid Social, Organic Search, etc.) bring in leads and customers and which ones don't.
On top of that, further details on each marketing channel are also provided. In Paid Search, for example, Attributer will also pass the Campaign, Ad Group, Ad, etc. depending on how you use your UTM parameters.
2. Landing Page Data
Attributer also sends to Jotform information on the first page the lead sees on your site (i.e., dropbox.com/blog/best-file-storage-tools) and the category of the said page (i.e., blog, features, etc.)
This is excellent when viewing related content as one item as a whole. For instance, you will know precisely how many leads your entire blog has generated and then be able to drilldown and see how many leads and customers each individual blog post has garnered.
3 example reports you can run when you capture Google Analytics data in Jotform and send it to your CRM
When you're using Attributer to capture Google Analytics data in Jotform and passing it through to your CRM, you can run a variety of reports to see what's working and what isn't.
Below are some of our favorite reports to run based on years of experience in marketing analytics:
1. Leads by Channel
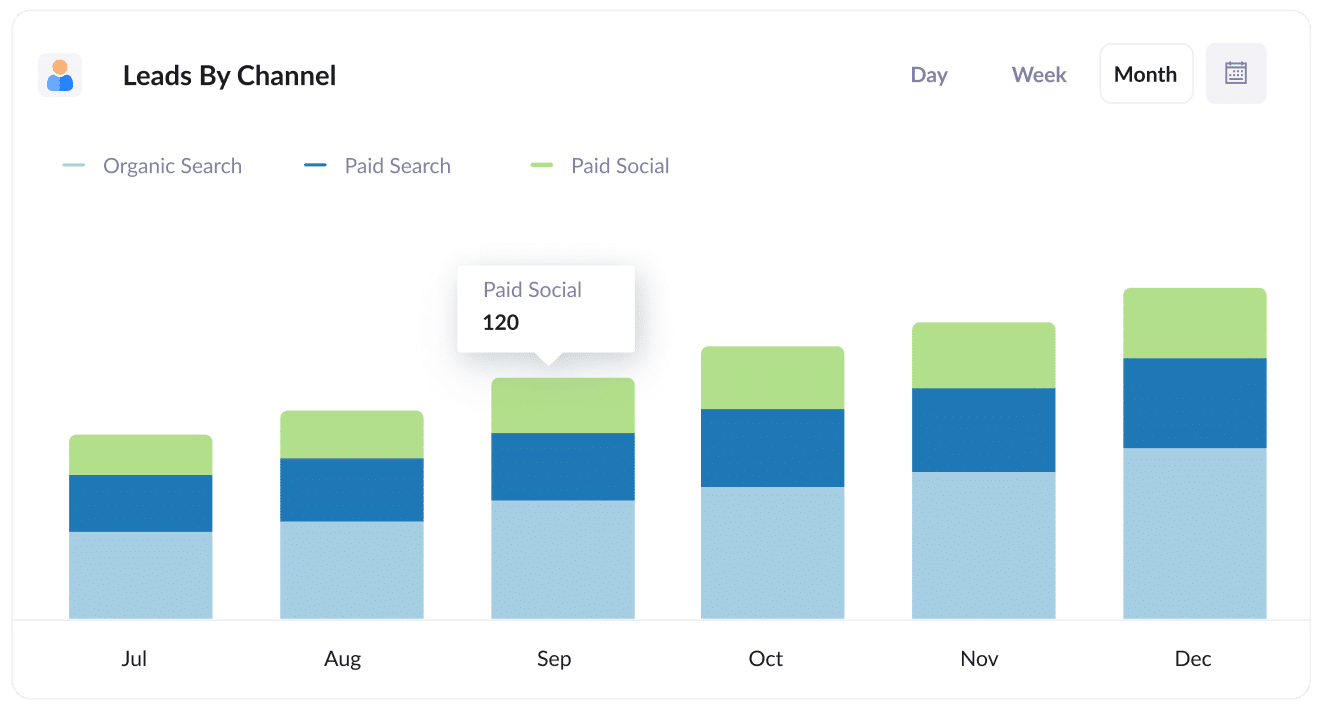
Just like many other businesses, you're probably getting visitors and leads from different channels like Organic Search, Paid Search, Organic Social, and more.
This report breaks down the number of leads you get each month by the channel they came from. It gives you a big-picture view of which channels are performing the best.
This can help you figure out where to focus your efforts and investments. For example, if most of your leads are coming from Organic Search but you're spending a lot on Paid Search, it might be a good idea to rethink your strategy.
2. Opportunities by Google Ads campaign
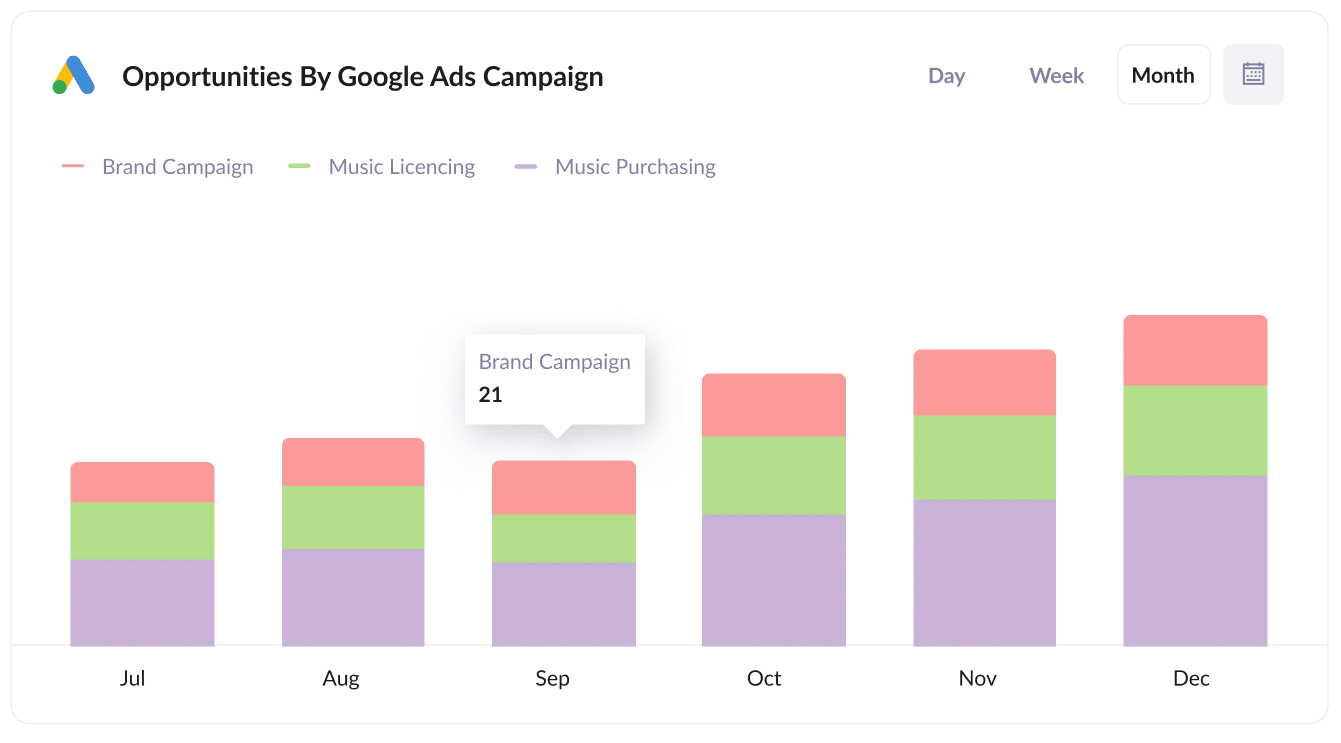
If you're like most businesses, you're probably running various campaigns in Google Ads and want to know how each one is doing.
This chart has got you covered. It shows the number of Opportunities generated each month, broken down by the Google Ads campaign they came from.
It helps you understand which campaigns are bringing in quality leads that actually turn into Opportunities for your sales team. This way, you can figure out where to invest more resources for maximum impact.
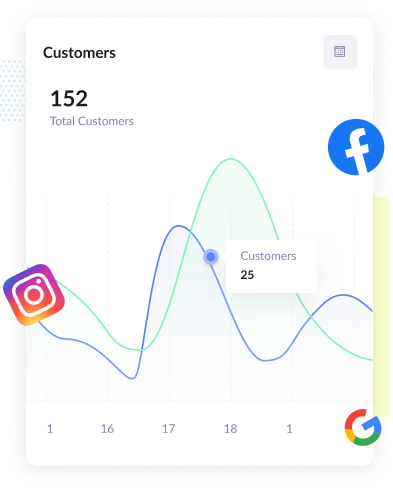
3. Customers by Facebook Ads Network
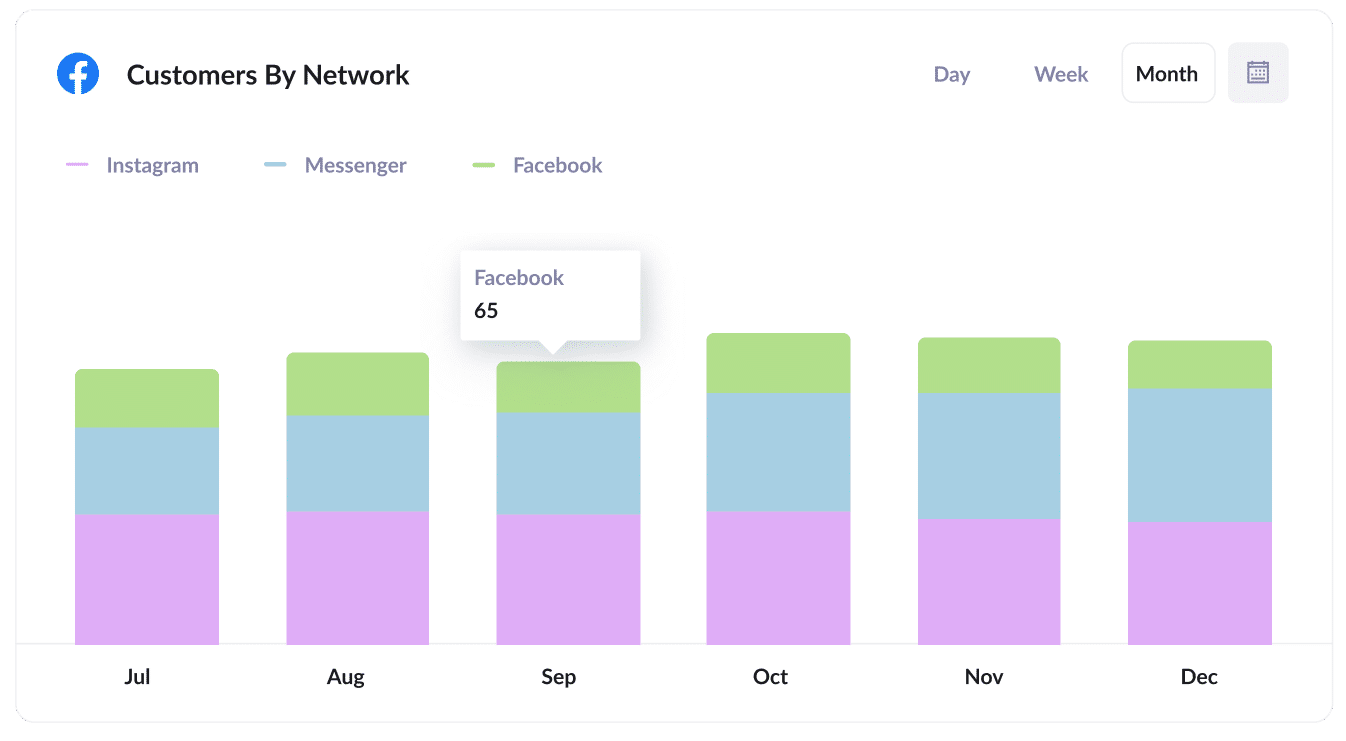
If you're running ads on Facebook, it's likely that your ads are being shown on other social media networks owned by Facebook, like Instagram, Messenger, and Whatsapp.
These networks have their own unique advertising environments, and it's pretty common for your ads to perform differently on each network.
In that case, the above graph can help. It displays the number of customers you've acquired from your ads on each network.
It helps you figure out which network works best for your business and where you should focus your budget.
Wrap up
Attributer is the ideal tool to capture Google Analytics data in Jotform and send it through your CRM (or other tools).
And by doing so, you can ultimately make more informed decisions regarding your marketing efforts and what you need to do to grow.
What’s more, you can try out Attributer and see what it can do for you without spending a dime. Start your 14-day free trial today!
Get Started For Free
Start your 14-day free trial of Attributer today!

About the Author
Aaron Beashel is the founder of Attributer and has over 15 years of experience in marketing & analytics. He is a recognized expert in the subject and has written articles for leading websites such as Hubspot, Zapier, Search Engine Journal, Buffer, Unbounce & more. Learn more about Aaron here.