How to capture Google Analytics data in Fluent Forms
Learn how you can capture data from Google Analytics, such as Channel and Landing Page, in Gravity Forms so you can track where your leads & customers are coming from.
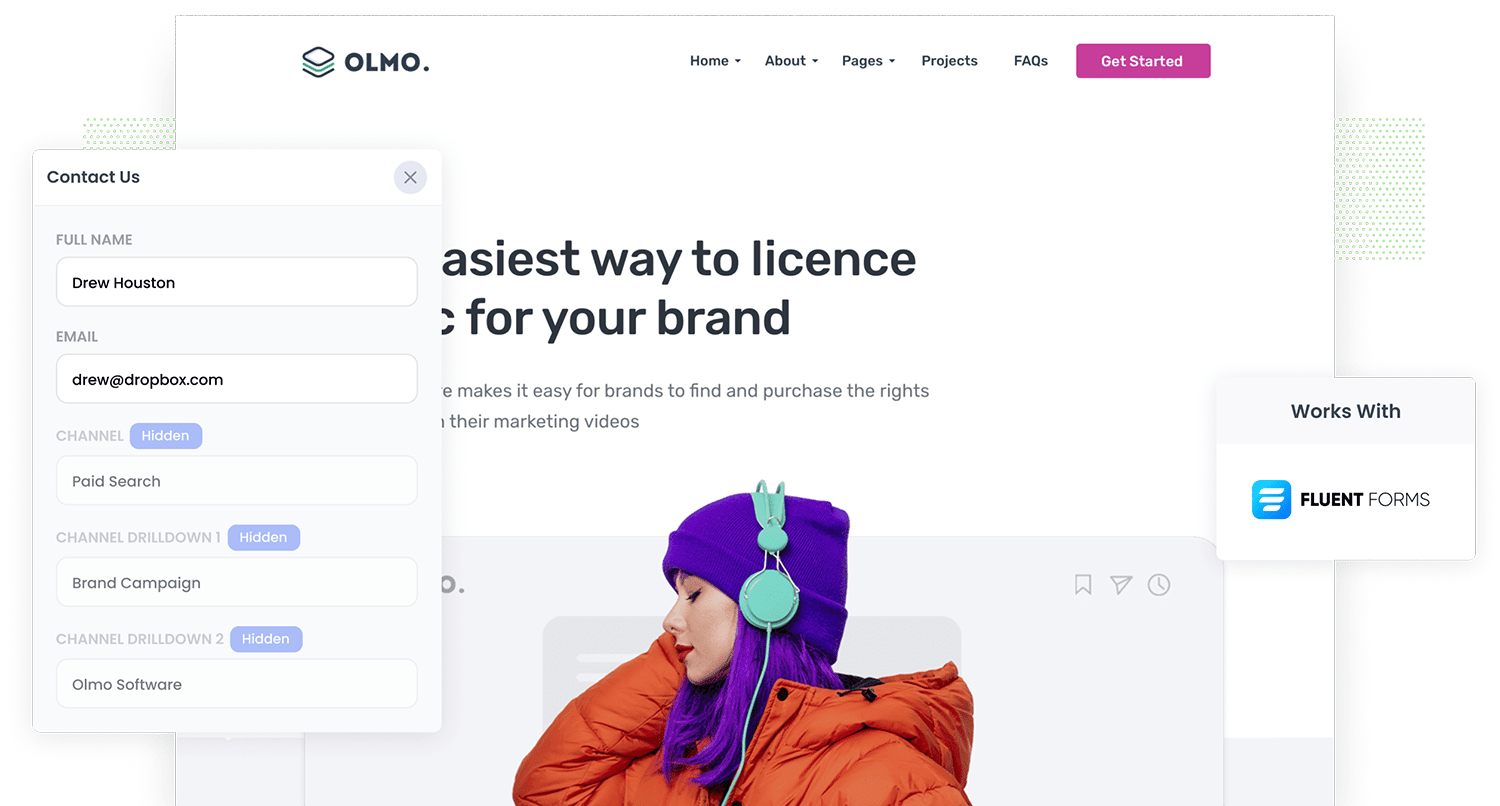
Do you know which marketing channels and campaigns are converting to leads, customers and revenue?
If not, how do you know what's working and what isn't?
By capturing Google Analytics data in Fluent Forms and sending it through to your CRM, you can run reports that show you exactly how many leads & customers you are getting from each of your marketing initiatives.
So in this article, we'll show you how to use a tool called Attributer to capture Google Analytics data (like what channel a lead came from) with each submission of your Fluent forms.
What is Attributer?
Attributer is a piece of code that you install on your website.
Attributer looks at technical information about a visitor that lands on your site (the same things as Google Analytics looks at) and uses it to determine where your visitor came from.
It then categorizes the visitor into a set of marketing channels - the same channels you see in Google Analytics, such as Organic Search, Paid Social and Paid Search.
It then stores the categorized data as a cookie in the user’s browser, and when they complete a form on your site, Attributer writes the Google Analytics data into a series of hidden fields you add behind your forms.
Then when they submit the form, this data is captured in Fluent Forms alongside the lead's name, email, etc. and can be sent into your CRM and other tools.
4 steps for capturing Google Analytics data in Fluent Forms
Using Attributer to capture Google Analytics data in Gravity Forms is easy. Here's how to do it in 4 easy steps:
1. Add hidden fields to your forms
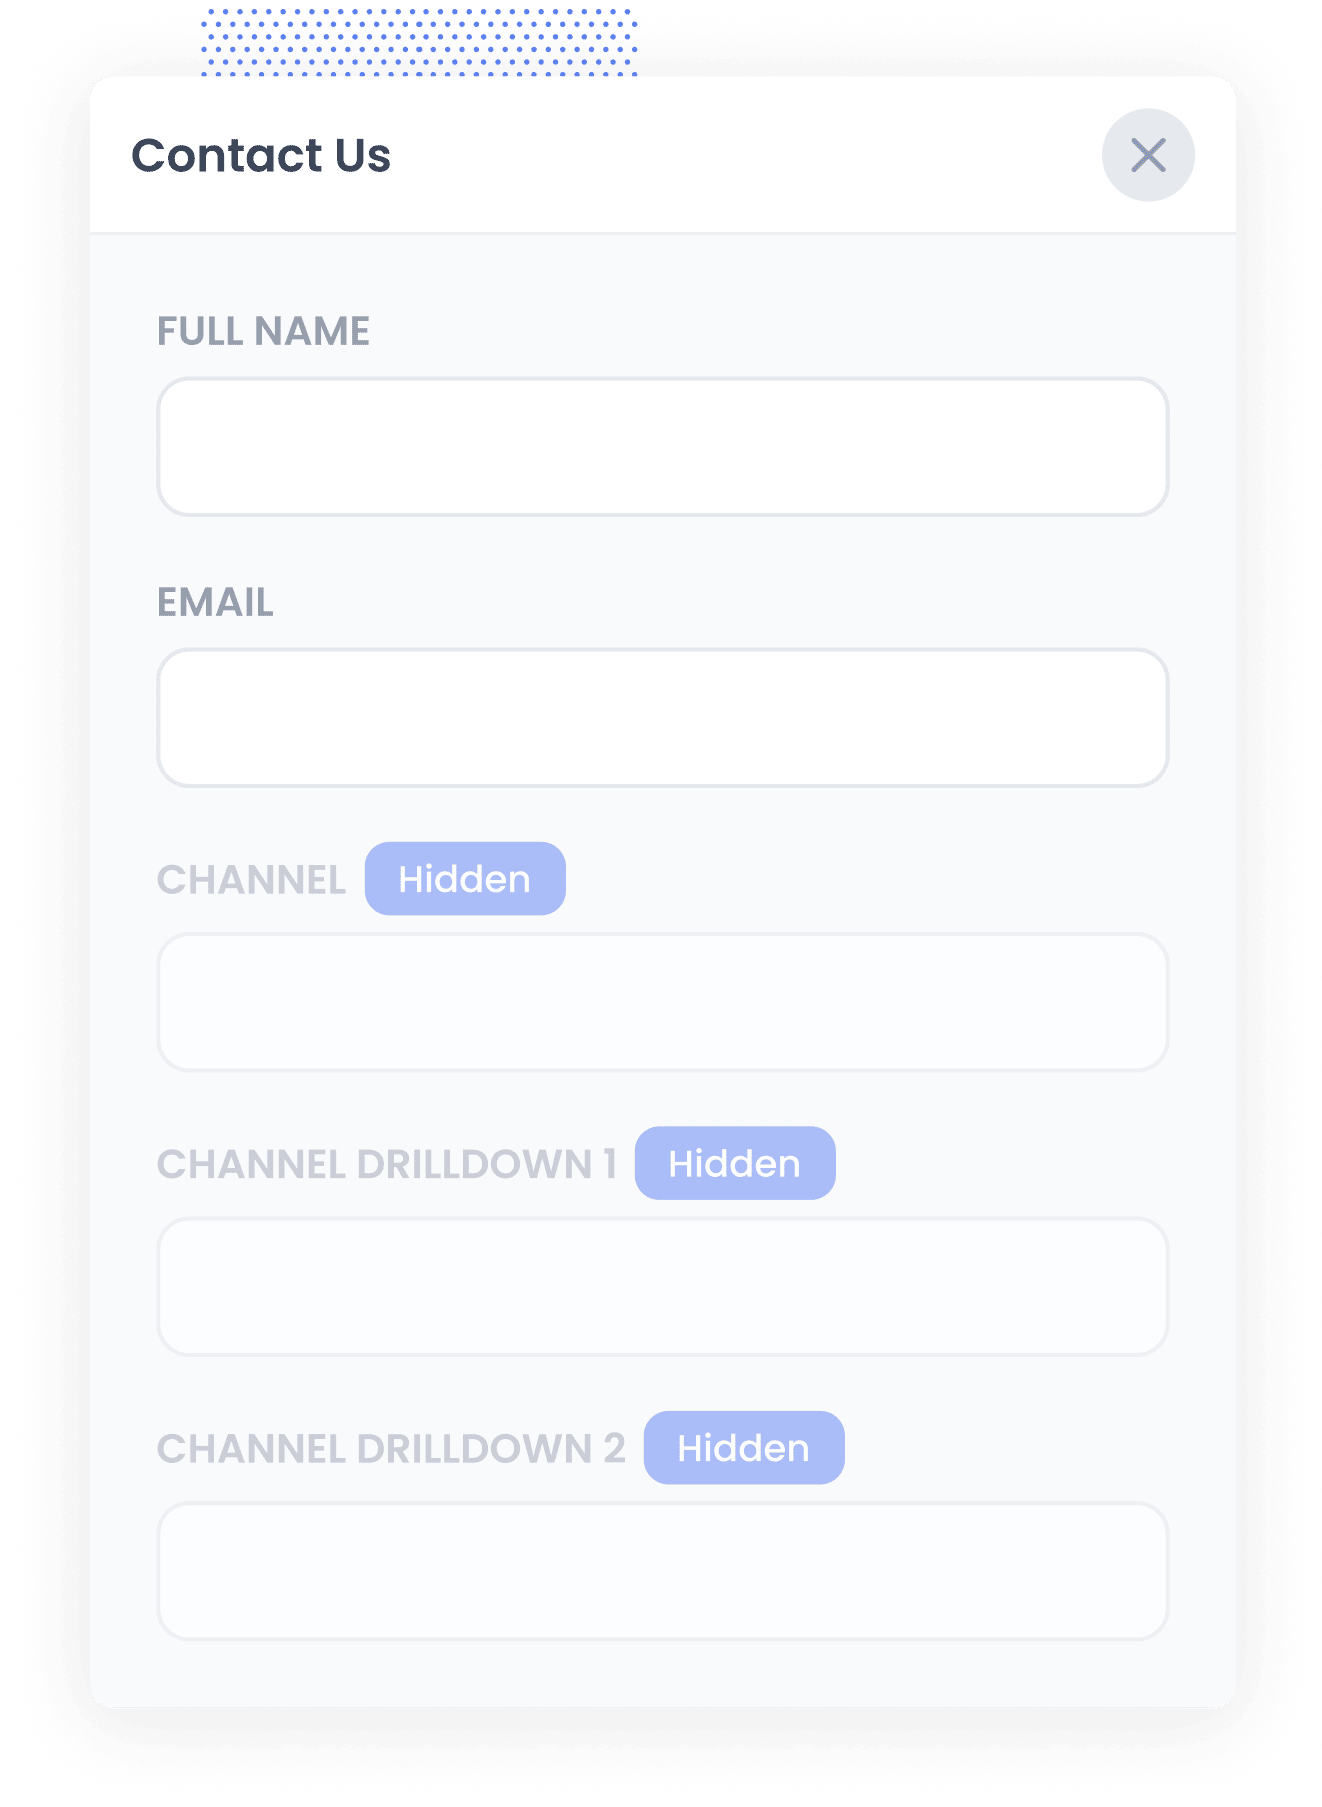
The first step is adding Hidden Fields to your lead capture forms. The hidden fields are:
- Channel
- Channel Drilldown 1
- Channel Drildown 2
- Channel Drilldown 3
- Landing Page
- Landing Page Group
Fluent Forms makes it easy to add hidden fields to your forms and step-by-step instructions are here.
2. Attributer automatically completes the hidden fields with Google Analytics data
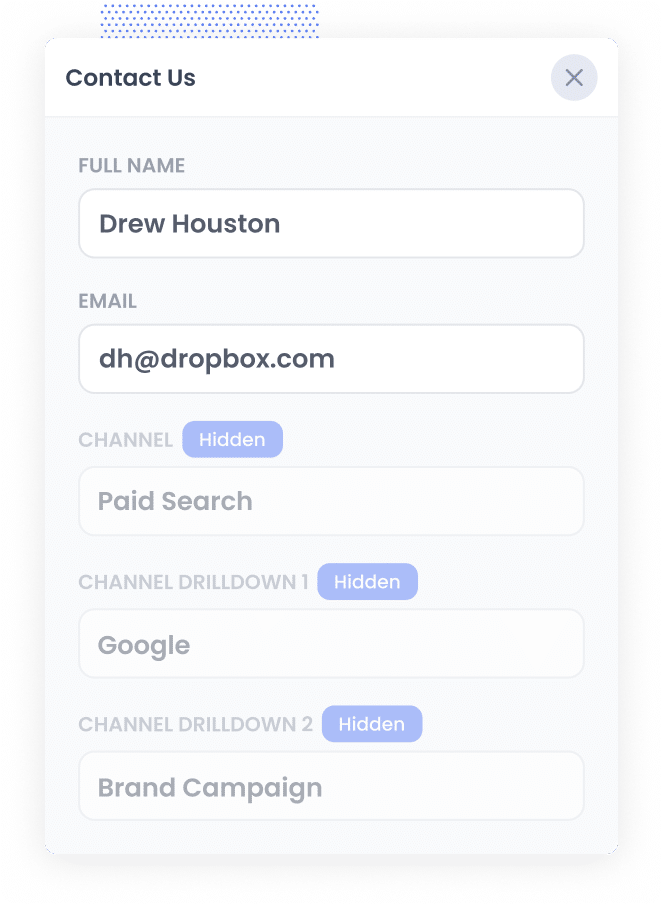
When a visitor completes a lead form on your site, Attributer populates the hidden fields you added to your form in step one with Google Analytics data.
To give you an idea of how this works, imagine you're a marketer for a legal firm and a visitor lands on your website via your brand campaign in Google Ads. Attributer would complete the hidden fields as follows (depending on what UTM parameters you put behind your ads):
- Channel: Paid Search
- Channel Drilldown 1: Google
- Channel Drilldown 2: Brand Campaign
- Channel Drilldown 3: Los Angeles Legal
Attributer would also capture the first landing page (i.e. www.losangeleslegal.com/services/litigation) and landing page group (i.e. Services) of the visitor, in addition to Channel data.
3. Google Analytics data is captured by Fluent Forms
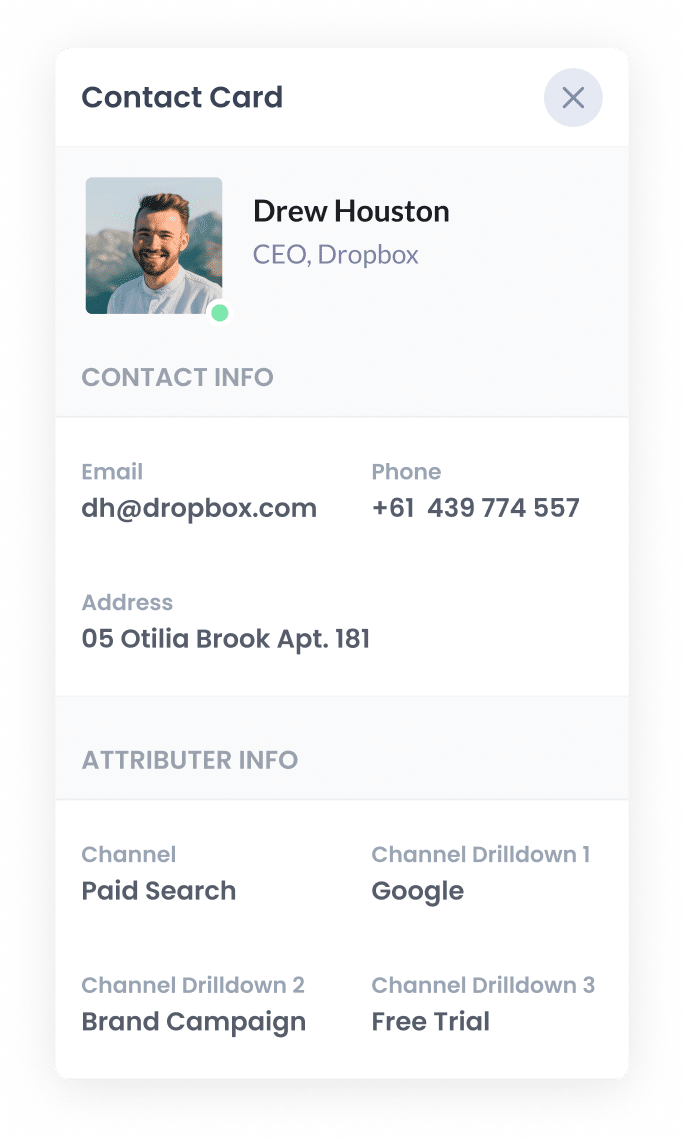
When a visitor submits the lead form the Google Analytics data that Attributer wrote into the hidden fields is captured by Fluent Forms and stored alongside the other information the visitor entered (like their name, email address, phone number, etc).
4. Run reports to see where your leads are coming from
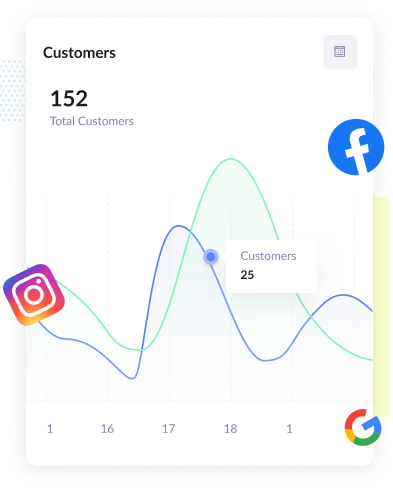
You can then use the native integrations in Fluent Forms (or 3rd party tools like Zapier) to send the Google Analytics data into your CRM (I.e. Salesforce, Pipedrive, Zoho CRM, etc) or other tools.
With the data provided by Attributer, you can then run reports that answer questions like:
- How many leads am I getting from my Google Ads?
- Which of my Facebook Ad campaigns are generating the most customers?
- How much revenue have I got from SEO in the past 3 months?
- And much more
What data gets captured in Fluent Forms
Attributer captures the following data in Fluent Forms:
1. Marketing Channel Data
Attributer captures the channel each of your leads came from (I.e. Paid Search, Organic Search, Paid Social, etc.) as well as further details on each channel (For Paid Search, for instance, Attributer will also capture Ad Group, Keyword, Campaign, etc.).
2. Landing Page Data
Attributer automatically captures the first page the lead sees on your site (I.e. losangeleslegal.com/blog/best-lawyers-in-los-angeles) as well as the category of the page (I.e. Blog).
This allows you to see how many leads your entire blog generated (for example) as well as drill down into how many leads & customers each individual blog post generated.
4 example reports you can run when you capture Google Analytics data in Fluent Forms
When you capture Google Analytics data in Fluent Forms and send it to your other sales and marketing tools (like your CRM or a spreadsheet), you can start to create reports that show how your various marketing initiatives are performing.
Before founding Attributer, I was a VP of Marketing for over 15 years. In that time, I ran hundreds of reports to understand where our leads & customers were coming from and where our biggest opportunities for growth were.
Here are a few of the reports I've found most useful over the years:
1. Leads by Channel
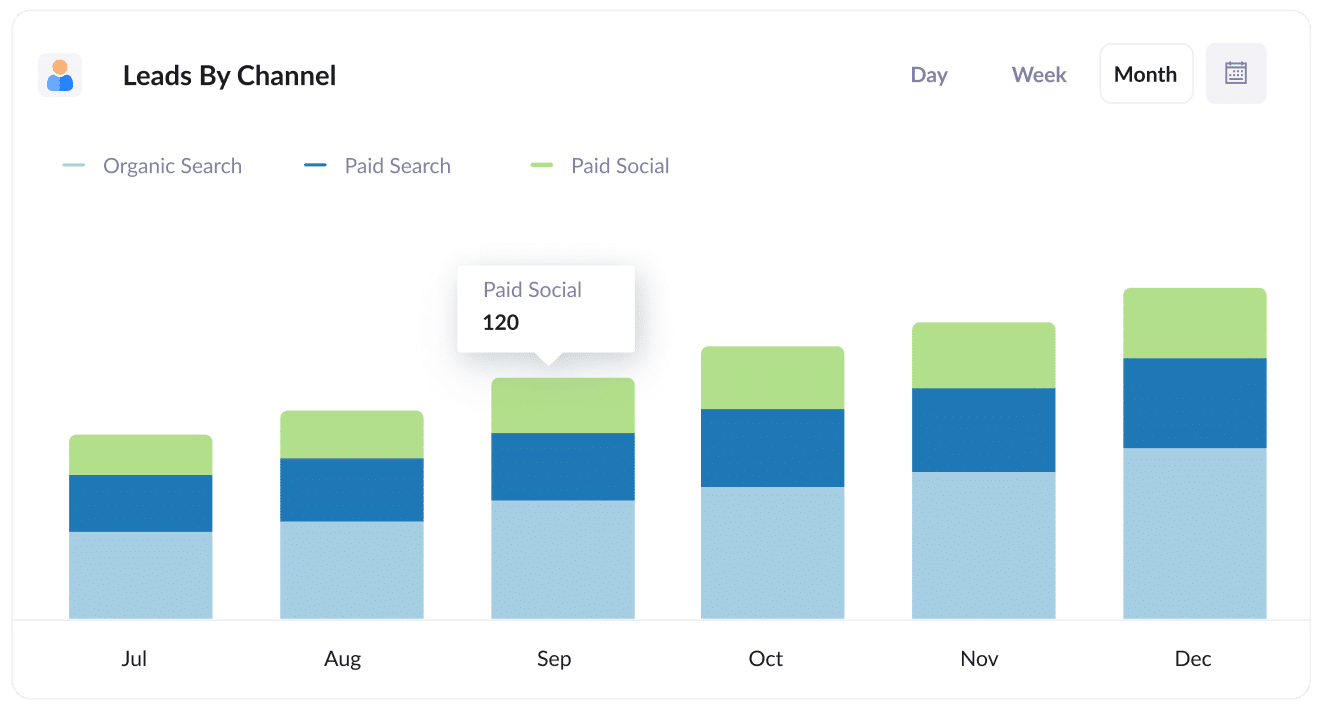
This report breaks down the number of leads you're getting each month by the channel they came from.
It gives you an overview of which channels are performing the best and can help you decide where to allocate your marketing budget.
For example, if you're getting most of your leads from Organic Search but spending a lot on Paid Search, it might be time to rethink your strategy.
2. Opportunities by Google Ads campaign
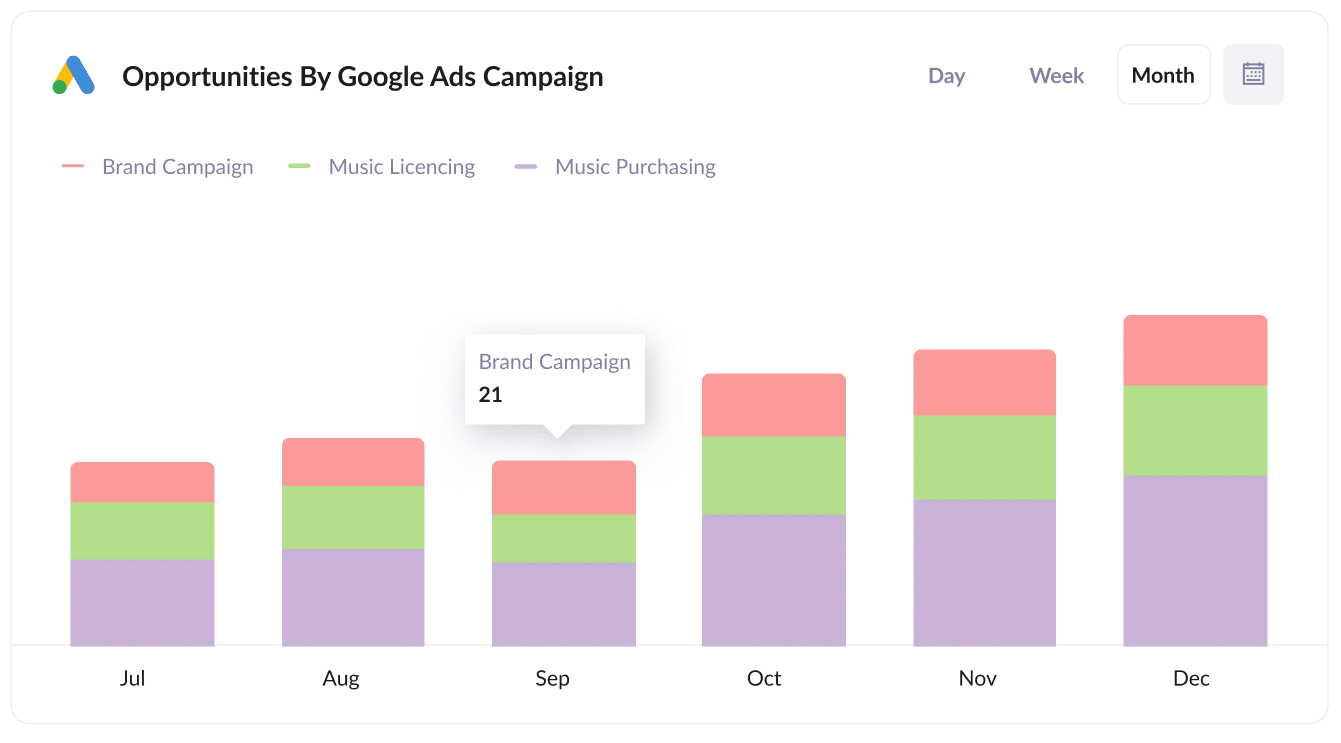
When you're running various campaigns on Google Ads and are keen to know how they're doing, this chart can help. It breaks down the number of opportunities generated each month based on the Google Ads campaign they came from.
This chart helps you figure out which campaigns are actually bringing in high-quality leads that turn into genuine Opportunities for your sales team. It's like a cheat code to help you decide where to invest your resources for maximum results.
3. Customers by Facebook Ads Network
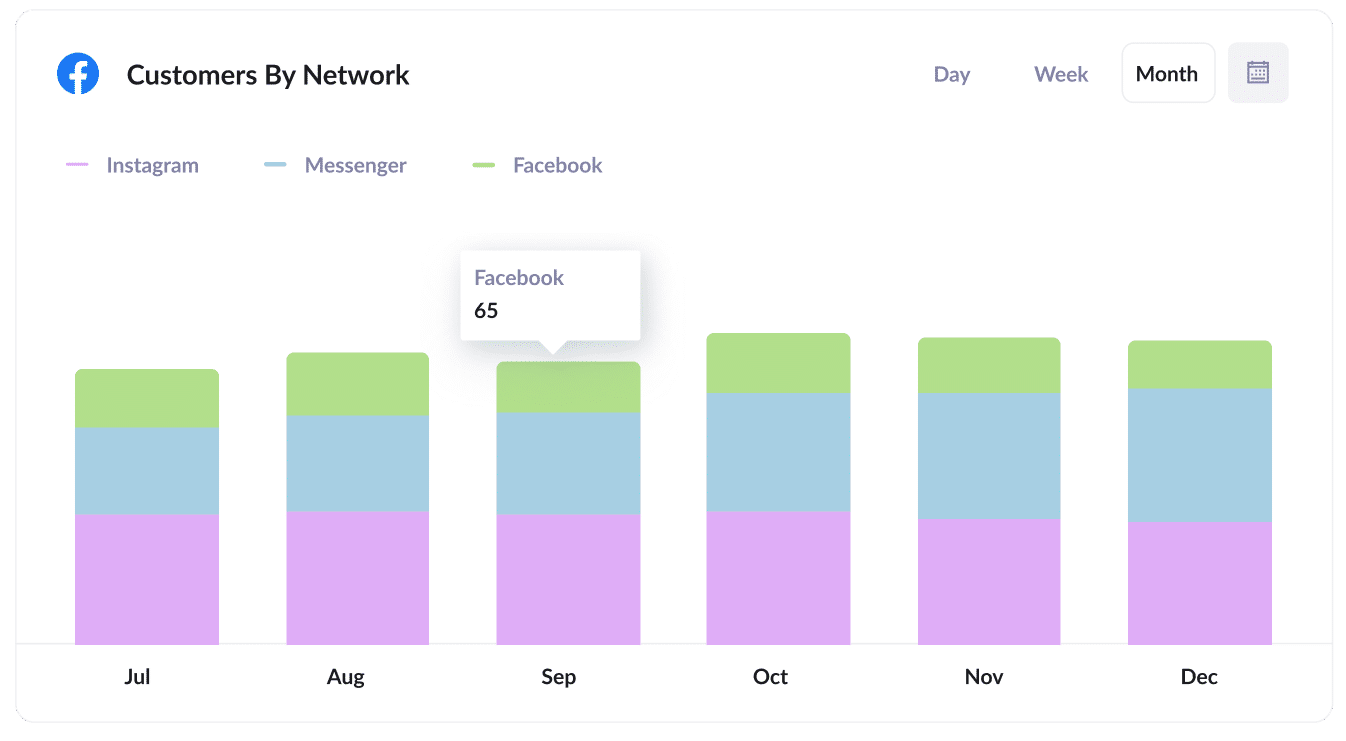
When you run ads on Facebook to promote your business, chances are they're appearing all over Facebook's platform (think Facebook, Instagram, Messenger, and Whatsapp).
In this case, the chart above can help. It shows how many customers you get from your ads on each network.
This helps you determine which network is performing best for your business, and enables you to focus your budget where it matters most.
4. Revenue from Organic Search by search engine
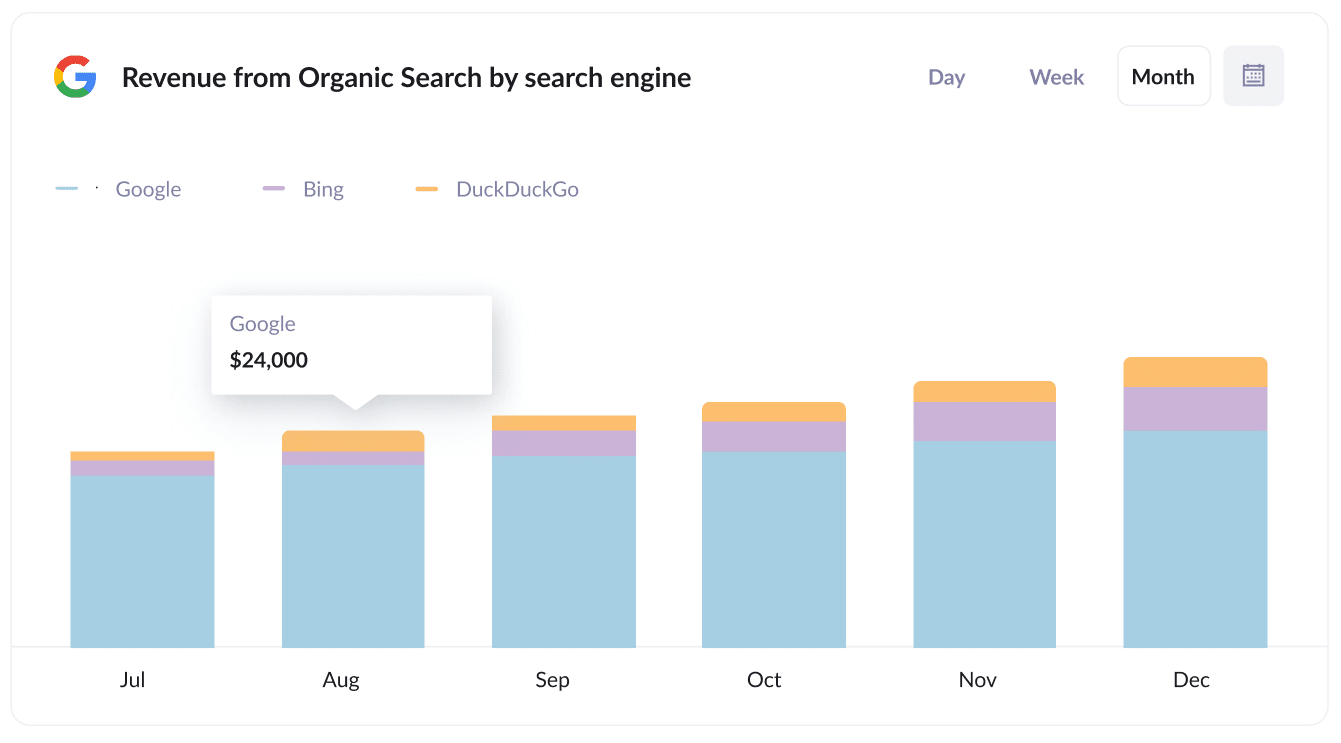
If you're investing in SEO to grow your business, this chart can be useful. It'll give you an understanding of how much revenue you've generated from customers that have come from Organic Search.
It can help you understand how your SEO efforts are performing relative to other channels (like Google Ads for instance), and can help you understand whether you should be increasing or decreasing your investment in SEO.
Wrap up
Attributer is a great tool to use if you're looking to capture Google Analytics data in Fluent Forms and pass it through to your CRM and other tools.
Set up is simple and once it’s up and running you can create detailed reports and dashboards in your sales and marketing tools (like a CRM) that show you everything from how your ad campaigns are performing to how your SEO efforts are going.
What's more, it's free to get started and usually takes less than 15 minutes to set up, so start your free trial today!
Get Started For Free
Start your 14-day free trial of Attributer today!

About the Author
Aaron Beashel is the founder of Attributer and has over 15 years of experience in marketing & analytics. He is a recognized expert in the subject and has written articles for leading websites such as Hubspot, Zapier, Search Engine Journal, Buffer, Unbounce & more. Learn more about Aaron here.
