4 simple steps to integrate Google Analytics data with Paddle
Quickly integrate Google Analytics data, such as channel and landing page information, into Paddle so you can run reports that show you where your signups, customers and revenue are coming from.
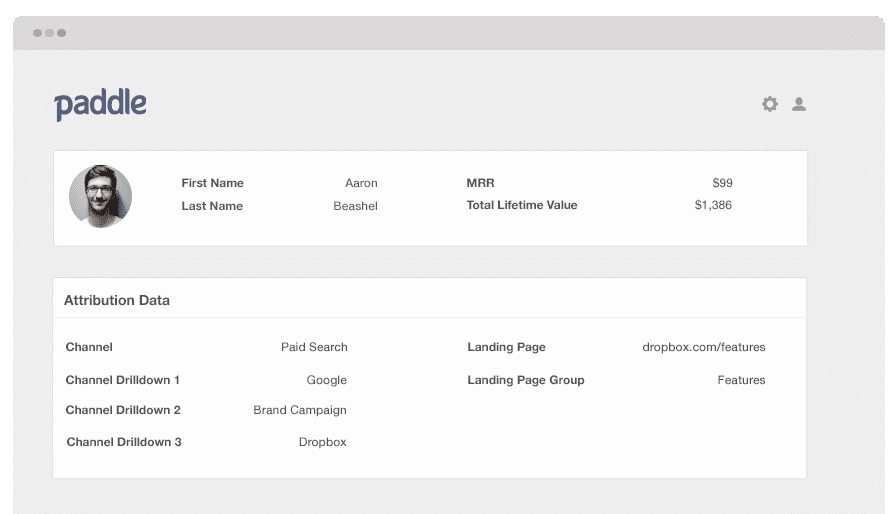
One of the many important elements of business growth is knowing which marketing channels and campaigns are responsible for generating the most customers, sign-ups, and revenue.
Google Analytics is a tool that can provide you with the data on which channels are driving visitors. However, its ability is limited because it can’t tell you which of your visitors have turned into customers, how much they pay you, their lifetime value, how frequently they churn, etc.
To obtain this type of information, you need to send the Google Analytics data to your billing platform so you can segment your revenue reports by channel and campaign.
Don’t exactly know how to do this? In this article, you’ll learn how Attributer can help you send the Google Analytics data to Paddle.
What is Attributer?
Attributer is a piece of code that you insert into your website. Every time a visitor reaches your site, Attributer checks some technical information to figure out where the visitor came from. It sorts each visitor according to several channels (like paid search, organic search, paid social, etc.) and keeps this data in a cookie in the visitor’s browser.
Whenever a visitor signs up for your product, Attributer sends the stored channel information into Paddle along with the lead’s information.
With this marketing attribution data in Paddle, you can now answer questions like:
- How many customers have I generated from my Google ads?
- What’s the average MRR of customers from my LinkedIn ads vs. customers from my Facebook ads?
- What’s the churn rate of customers from organic Google searches?
Integrate Google Analytics data and Paddle in 4 steps
Using Attributer to connect Google Analytics data with Paddle is easy. Here's how to do it in 4 easy steps:
1. Add hidden fields to your forms
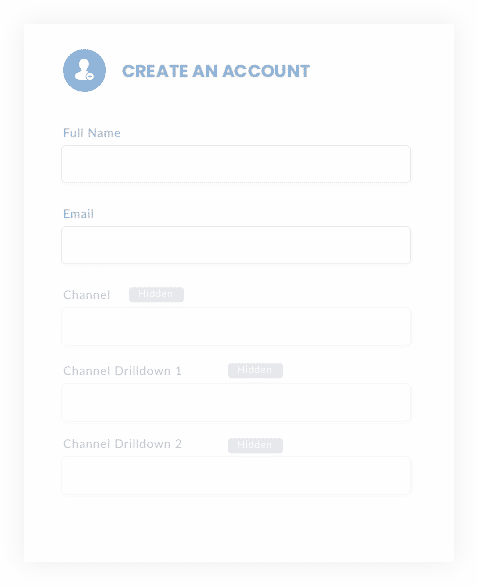
First up, add multiple hidden fields to your sign-up forms. These hidden fields include:
- Channel
- Channel Drilldown 1
- Channel Drildown 2
- Channel Drilldown 3
- Landing Page
- Landing Page Group
Alternatively, you can write a simple piece of javascript to pull the data from the cookie and send it through to Paddle when a user completes a signup form. This is handy if you have Google or Facebook signup options where a user can create an account without actually completing a form. For more information on this, check out this help article.
2. Automatically fill those hidden fields with Google Analytics data
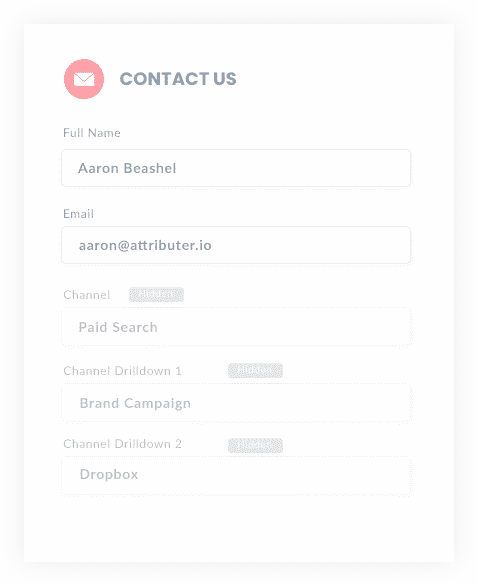
Attributer looks at where your visitors are coming from and once they complete a form on your website, it populates the hidden fields with Google Analytics data.
As an example, if I was a marketer at Salesforce and a visitor came to my website from a brand campaign in paid search, it would populate the hidden fields as follows (depending on the UTM parameters I used behind my ads):
- Channel = Paid search
- Channel Drilldown 1 = Google
- Channel Drildown 2 = Brand campaign
- Channel Drilldown 3 = Dropbox
On top of the information on channel, it would also capture the visitor's first landing page (i.e. Salesforce.com/blog/best-crm-software) and the first landing page group (i.e. /blog)
3. Google Analytics data appears in Paddle
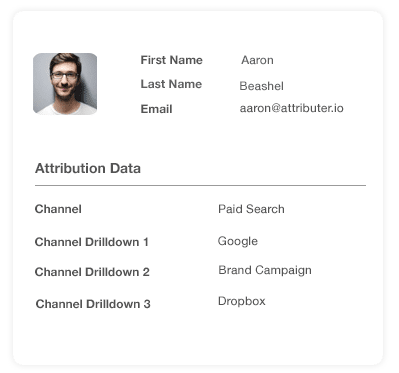
Every time a visitor fills out a form on your site, the Google Analytics data stored in the cookie is transferred into Paddle along with the other data entered in the form, including the lead’s name, company name, email address, etc.
4. Run reports to understand which channels are driving leads, customers and revenue
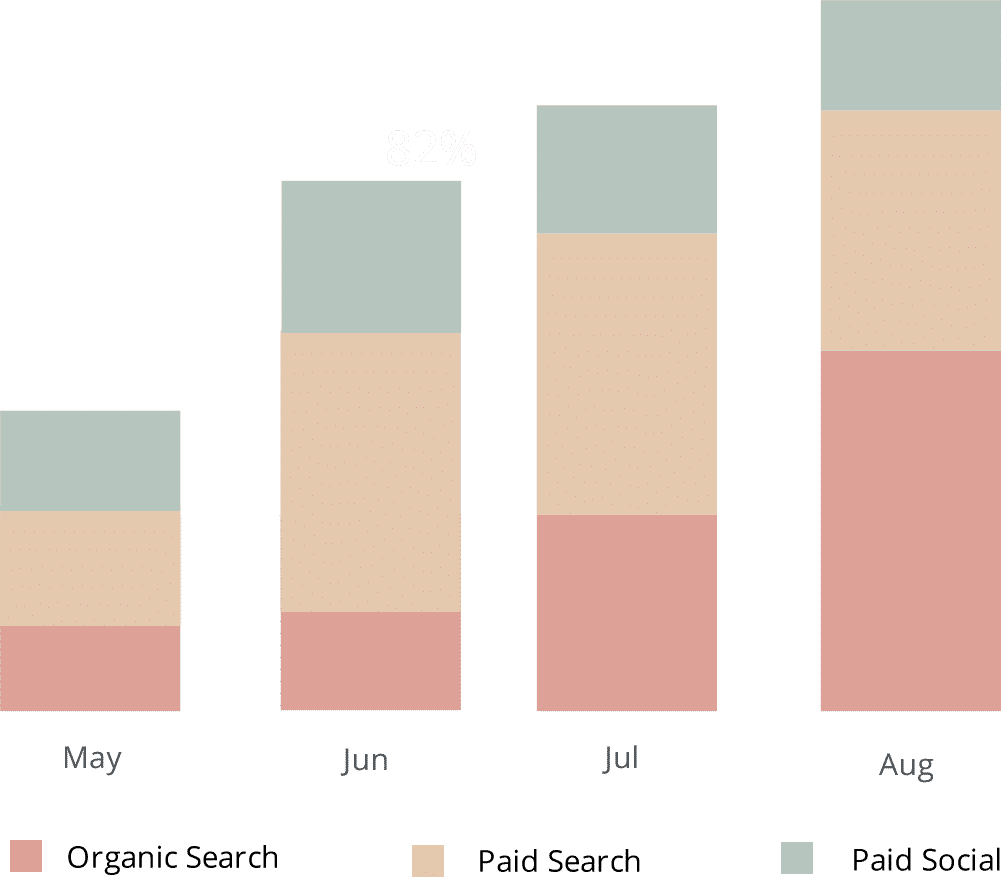
Assuming the Google Analytics data is now in Paddle, running reports displaying your different subscription metrics is now possible. These metrics are broken down by marketing channel and/or campaign where the customer came from.
These include:
- New trials added each month by channel or campaign
- Trial to customer conversion rate by channel or campaign
- New customers added each month by channel or campaign
- New MRR added each month by channel or campaign
- New ARR added each month by channel or campaign
- ARPU by channel or campaign
- Lifetime value by channel or campaign
- Customer churn rate by channel or campaign
- MRR churn rate by channel or campaign
What data gets passed into Paddle?
With years of experience, we here at Attributer have come to a conclusion that there are two vital elements to attribution:
- Channel - How did visitors arrive at your site? Usually one of organic search, paid search, paid social, referral, etc.
- Landing Page - Which content did they find attractive? It could be your features pages, blog, ebooks, etc.
As an outcome of this, we decided to build Attributer so that it can gather all the information you need to understand what's working and why.
1. Marketing channel data
Attributer automatically records the channel your leads come from (i.e., organic search, paid social, paid search) as well as additional detail on each channel (i.e., for paid search, it also captures the ad group, campaign, keyword, etc.)
2. Landing page data
Attributer intuitively gathers the data about the first page that the lead landed on (i.e., dropbox.com/blog/best-file-storage-tools) as well as the category of the page (i.e., blog).
This information is excellent for looking at related content as a whole. For example, you can see how many leads your entire blog section has generated and zero in on each blog post’s performance too.
What you can do with all this data?
When Google Analytics data is inside Paddle, you’ll be able to do the following:
1. Report on channels
With the Google Analytics data available right inside Paddle, running reports is possible. These reports can provide insights into questions like:
- How many signups did you get from your Google ads?
- What's the signup-to-customer conversion rate of leads from Google ads?
- How many customers have been generated by your Google ads?
- How much MRR or ARR has been generated by your Google ads?
- What's the lifetime value of customers from your Google ads, and how does that compare to other channels?
- What's the overall ROI of your Google ads (spend/revenue generated)?
You can build reports using Paddle's native reporting tools, or send the data to any analytics and business intelligence tools that integrate with Paddle to run more in-depth reports there.
2. Report on content
Since Attributer also captures each visitor’s landing page data (and landing page group data), you can create reports that exhibit how your site content is performing.
Some of the questions that can be answered through these reports are the following:
- How many signups did I get from my blog?
- Which blog posts have delivered the most signups?
- Which blog posts are converting people into customers?
- What is the ROI of my blogging efforts?
You can also view the performance of specific sections on your site regarding the conversion rate of customers. For example, you could see how your blog is generating a lot of visitors and sign-ups, but only a few are actually being converted into customers. With this information, you may decide whether to continue your efforts or allocate your time and resources elsewhere.
Wrap up
If your goal is to get Google Analytics data into Paddle, then Attributer is an excellent tool that can do precisely this.
It is easy to install, and once it’s operational it will let you run detailed reports and dashboards inside Paddle. These reports and dashboards can show the performance of your content, campaigns, SEO efforts, and more.
Have we mentioned that it’s free to start? Start your free trial today and see if it fits your needs.
Get Started For Free
Start your 14-day free trial of Attributer today!

About the Author
Aaron Beashel is the founder of Attributer and has over 15 years of experience in marketing & analytics. He is a recognized expert in the subject and has written articles for leading websites such as Hubspot, Zapier, Search Engine Journal, Buffer, Unbounce & more. Learn more about Aaron here.
